What are the TSMs
In April 2023, the Regulator of Social Housing introduced Tenant Satisfaction Measures (TSMs), to help social housing tenants see how well their landlord is performing compared to other organisations. There are 22 measures, covering 5 themes. The data is collected through management information and a resident survey. Ten of these are measured by landlords’ existing information, and twelve are measured by landlords carrying out tenant ‘perception surveys’ which ask people to share their experiences and opinions. You can read the full list of TSMs here and here is how we’re improving our services based on feedback.
What did we ask?
We asked a set of questions set out by the Regulator, which have to be asked in a set order and using specific wording – to help residents compare the results.
You can read the survey we used to calculate the TSM measures here.
If you took part, thank you for sharing your views. This provides us with an accurate picture of how our residents view our services and where we can improve. Residents are not offered incentives to take part.
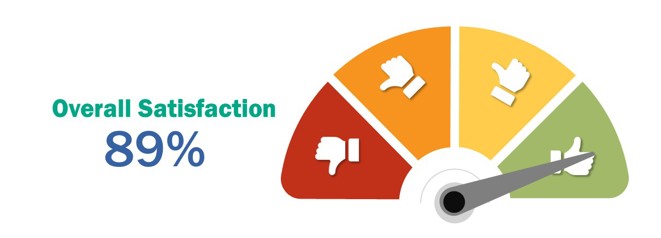
Our results
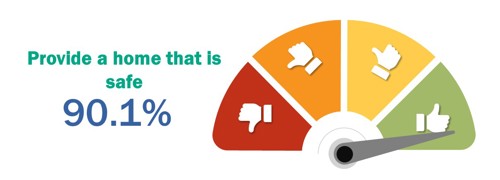
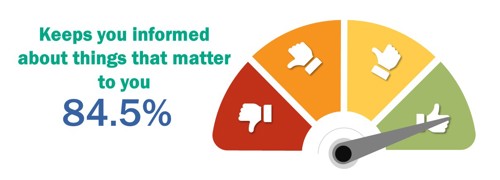
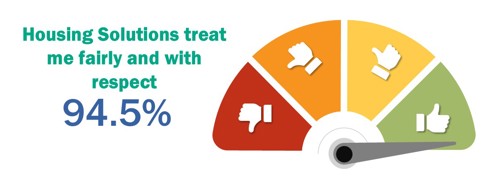
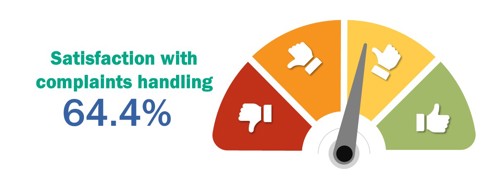
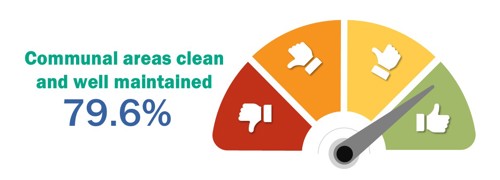
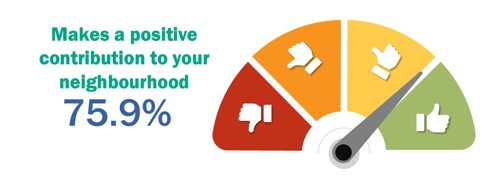
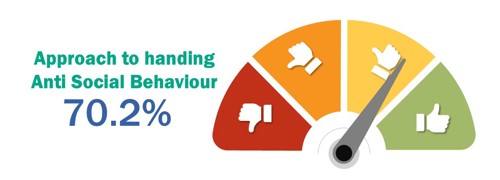
Please see the below set of infographics to see how we are doing in 2025/26 based on our surveys carried out between September 2025 and March 2026.
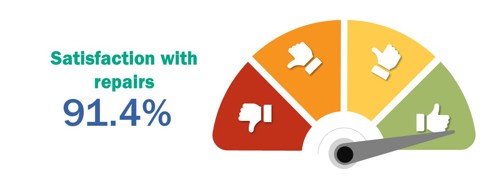
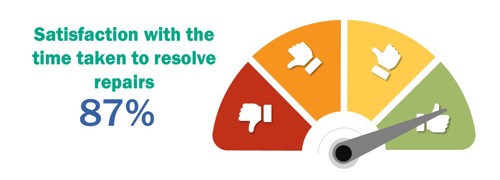
Keeping properties in good repair
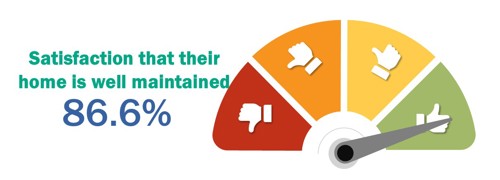
Maintaining building safety
Respectful and helpful engagement

Effective complaints handling
Responsible neighbourhood management
2025-26 Approach
Stock and Sampling: Our low-cost rental stock consisted of 5,165 homes, as per the Statistical Data Return 2025. To ensure a statistically valid sampling approach and achieve a minimum overall accuracy of +/- 4% at a 95% confidence interval (as per the established TSM requirements), a minimum of 539 surveys were needed from the eligible population. Our sample was generated using stratified random sampling based on Place Type, Property Type, and Local Authority.
Survey Completion: We scheduled 600 surveys and completed 577. This exceeds the minimum requirement and will contribute to a robust understanding of resident satisfaction. (Note: With 577 completed surveys from an eligible population of 5,145, the margin of error at a 95% confidence interval is approximately +/- 3.8%, the target +/- 4%.). No incentives were offered to encourage survey completion.
Data Collection Methods: In order to ensure comparability, we closely matched the method of survey collection we adopted last. Following on from last year, all surveying was conducted by our in-house teams.
· Face to face surveys: 63.6% These surveys were collected by Housing Solutions staff across the business over the surveying period. We focused on face-to-face surveying, as tenants have expressed a preference for direct interaction.
· Telephone Surveys: 36.40% These surveys were completed within our contact centre team, who were provided the necessary guidance to conduct the surveys in accordance with the TSM requirements. We also include telephone surveys to diversify our approach and reduce potential bias in the results.
Exclusions: From the population, 20 residents were excluded under permissible exceptional circumstances on the basis that residents are unlikely to provide a meaningful response to the vast majority of the TSM questions.
Survey Period: The surveys were completed between 12th September 2025 and 26th March 2026.
Representative Sample
The RSH requires that our TSM sample is representative of your tenant population to ensure that there are no bias which effects the results of the TPS. If a provider does not achieve a representative sample, they must apply weighting to their survey. The method in which we sampled our tenant base meant that we required no weighting.
We assessed representativeness by comparing survey respondents to the overall tenant population across various key characteristics.
| Total Survey Responses (% Total) | Relevant Tenant Population (% Total) | Difference | |
| Housing Type | |||
| Affordable Housing | 11.96% | 10.57% | 1.39% |
| General Needs | 76.78% | 77.78% | -1.00% |
| Keyworker | 0.52% | 0.52% | 0.00% |
| Sheltered Housing | 9.19% | 5.81% | 3.38% |
| Supported Housing | 1.56% | 5.31% | -3.75% |
| Local Authority | |||
| Basingstoke | 0.54% | 0.56% | -0.02% |
| Bracknell | 2.14% | 1.09% | 1.05% |
| Buckinghamshire | 13.57% | 12.79% | 0.78% |
| Windsor and Maidenhead | 65.71% | 66.20% | -0.49% |
| Reading | 0.54% | 2.31% | -1.77% |
| Slough | 6.43% | 5.46% | 0.97% |
| South Oxfordshire | 0.54% | 0.56% | -0.02% |
| Wokingham | 10.54% | 11.02% | -0.48% |
| Property Type | |||
| Bungalow | 2.08% | 2.86% | -0.78% |
| Caravan | 1.73% | 1.34% | 0.39% |
| Coach House | 0.00% | 0.02% | -0.02% |
| Flat | 42.29% | 44.88% | -2.59% |
| House | 43.50% | 42.68% | 0.82% |
| Maisonette | 2.77% | 3.52% | -0.75% |
| Scheme | 7.63% | 4.66% | 2.96% |
| Studio Flat | 0.00% | 0.04% | -0.04% |
| Tenant Age Band | |||
| 1900-1909 | 0.69% | 0.40% | 0.30% |
| 1920-1929 | 0.17% | 0.14% | 0.04% |
| 1930-1939 | 2.95% | 2.00% | 0.95% |
| 1940-1949 | 6.41% | 6.14% | 0.27% |
| 1950-1959 | 15.08% | 12.54% | 2.53% |
| 1960-1969 | 22.36% | 19.36% | 3.00% |
| 1970-1979 | 16.29% | 20.35% | -4.06% |
| 1980-1989 | 18.89% | 21.53% | -2.64% |
| 1990-1999 | 14.73% | 14.11% | 0.63% |
| 2000-2009 | 2.43% | 3.44% | -1.01% |
| Tenant Gender | |||
| F | 63.95% | 62.80% | 1.15% |
| M | 35.01% | 35.48% | -0.47% |
| O | 1.04% | 1.72% | -0.68% |
| Tenant Ethnicity | |||
| Asian or Asian British | 5.54% | 5.43% | 0.10% |
| Black, Black British, Caribbean or African | 3.21% | 3.81% | -0.60% |
| Mixed or multiple ethnic groups | 1.79% | 1.74% | 0.05% |
| Other ethnic group | 5.89% | 5.91% | -0.01% |
| Prefer not to say / Unknown | 21.61% | 21.71% | -0.10% |
| White | 61.96% | 61.40% | 0.57% |
Management Information Measures
Building Safety
| BS01 | Proportion of homes for which all required gas safety checks have been carried out. | 100% |
| BS02 | Proportion of homes for which all required fire risk assessments have been carried out. | 100% |
| BS03 | Proportion of homes for which all required asbestos management surveys or re-inspections have been carried out. | 100% |
| BS04 | Proportion of homes for which all required legionella risk assessments have been carried out. | 100% |
| BS05 | Proportion of homes for which all required communal passenger lift safety checks have been carried out. | 100% |
Anti Social Behaviour
| NM01 (1) | Number of anti-social behaviour cases opened per 1,000 homes. | 27 |
| NM01 (2) | Number of anti-social behaviour cases that involve hate incidents opened per 1,000 homes. | 1.5 |
Decent Home Standards & Repairs
| RP01 | Proportion of homes that do not meet the Decent Homes Standard. | 0 |
| RP02 (1) | Proportion of non-emergency responsive repairs completed within the landlord’s target timescale. | 91.2% |
| RP02 (2) | Proportion of emergency responsive repairs completed within the landlord’s target timescale. | 97.7% |
Complaints
| CH01 (1) | Number of stage one complaints received per 1,000 homes. | 20.6 |
| CH01 (2) | Number of stage two complaints received per 1,000 homes. | 2.9 |
| CH02 (1) | Proportion of stage one complaints responded to within the Housing Ombudsman’s Complaint Handling Code timescales. | 100% |
| CH02 (2) | Proportion of stage two complaints responded to within the Housing Ombudsman’s Complaint Handling Code timescales. | 100% |